For those of you unfamiliar with it, here's a brief example. Let's say you're the Blue Yuppies, a political party that is really popular with the hipster downtown folk, but not so much with suburban soccer moms. You won the last election in a city with four seats, but have lost popularity recently, and your polling tells you that neighborhoods in your city would vote like this in an upcoming election:
 |
| Super idealized city |
 |
This is what gerrymandering is. Redistricting is a huge power to have over your opponents between elections, because it can be leveraged quite well to retain power even against the popular vote of an area. And it's not always necessarily about giving yourself the comfortable easy seats - as in the bottom right example above, lumping all your opponent's support together can be a very effective way to secure the rest for yourself.
This often results in very funny looking districts. In the first three examples above, you could maybe justify most of the districts as effectively representing a region of the city. The gerrymandered one, though, has long snaky districts, in order to get the right sorts of people voting together.
Gerrymandering is alleged to happen in the USA a lot. Take a look at some of these examples and decide for yourself:
 |
| Capture ALL the cities! |
 |
| Snaky... |
 |
| Because you know that highway is an important part of the district... |
After too many shenanigans like this going on, some states are starting to insist on bipartisan committees to come up with new district boundaries, hoping to take the advantage away from the parties in power. The problem with this, though, is that the only thing the committee members from different parties tend to agree on is that they don't want to lose the next elections, and they may end up carving out districts that serve mostly to maintain their seats, leading to safe and boring elections. Yikes.
Canada, on the other hand, tends to have completely independent commissions in charge of redistricting, with the goal of avoiding gerrymandering. But how well does our system actually work?
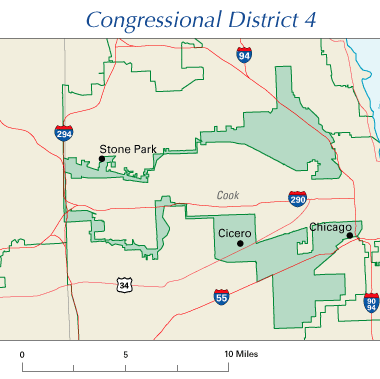
One way to check for potential gerrymandering is to check a district for its compactness. The underlying assumption here is that no point in a riding should be too far away from the middle, and that the riding should represent a reasonably consistent geographical area. Shapes like circles or squares are the most compact, shapes like Congressional District 4 up there aren't.
This fun report took a very in-depth look at compactness in voting districts in both the US and Canada. They measured compactness by comparing the perimeter of a district with the square root of the area, and then factored it so that a perfect square has a compactness value of exactly 1.
So how did Canada compare to the US? The average compactness values for 2006 were:
- Canada: 1.400
- USA: 2.103
From the report, the historical comparisons look like this:
 |
| Hill, 2009 |
For reference, if the average national districts were rectangles with the same areas, this is how they'd look:

So on that measure, Canada's pretty much always been better than the USA in terms of compactness (and, implied, in terms of likely gerrymandering), and the USA has seen a marked increase since about the early 1990s.
But wait! Canada just did a full round of redistricting! We now have 338 ridings instead of 308. These are exciting times! Just how well did the commission do?
My analysis of the 338 districts using the same methodology as Hill (2009) shows an average compactness of: 1.408. In other words, nothing too much to worry about form a gerrymandering point of view! Hooray Canada for mostly transparent electoral systems!
The averages per province ranged from 1.27 for PEI to 1.59 for New Brunswick, and only six federal ridings had a compactness score worse than the average American district.
 |
| Saskatchewan was solid (average: 1.31) |
 |
| Newfoundland and Labrador averaged 1.52, because shores are tricky |
The great thing is that Canadian boundaries are still good, even at the provincial legislature level. Of Alberta's 87 provincial electoral districts, the average compactness is still only 1.440, very similar to the federal average and still way lower than the American average. In fact, only one Albertan district is worse than the average American district. Take a look at this super cool interactive thingy I made:
With the exception of Chestermere-Rocky View (which looks like it's giving Calgary a hug), all of these ridings are pretty reasonable, and they're all better than the average American voting district.
Go Canada! Our politics may not always be pretty, but at least there's no sign of anyone actively tinkering with them!
Go Canada! Our politics may not always be pretty, but at least there's no sign of anyone actively tinkering with them!